How is the Los Angeles real estate market doing? The charts below are broken down by single family homes and condos and compare March 2019 to February 2019 and the same period the previous year.
This is a small sample size but stay tuned to see the trend in the coming months
| Single Family Median Sales Price | ||||||||
| Area | Mar 2018 | Mar 2019 | Feb 2019 | |||||
| Beverly Hills | $6,754,500 | $6,319,079 | $6,950,000 | |||||
| Beverly Hills Post Office | $2,000,000 | $4,775,500 | $3,207,500 | |||||
| Sunset Strip – Hollywood | $1,880,000 | $2,009,000 | $2,604,940 | |||||
| Bel Air – Holmby Hills | $2,305,000 | $1,762,500 | $1,515,000 | |||||
| Westwood – Century City | $2,412,500 | $1,838,000 | $2,022,812 | |||||
| Brentwood | $3,800,000 | $3,760,000 | $2,830,000 | |||||
| West L.A. | $1,382,000 | $1,220,000 | $1,260,000 | |||||
| Cheviot Hills – Rancho Park | $2,465,000 | $2,550,000 | $2,189,500 | |||||
| Beverlywood Vicinity | $1,730,000 | $1,505,000 | $1,740,000 | |||||
| West Hollywood Vicinity | $1,775,000 | $3,007,500 | $1,575,000 | |||||
| Venice | $2,399,000 | $2,365,500 | $1,940,000 | |||||
| Marina Del Rey | $1,450,775 | $1,650,000 | $1,490,000 | |||||
| Palms – Mar Vista | $1,622,500 | $1,623,750 | $1,316,500 | |||||
| Santa Monica | $2,800,000 | $2,529,000 | $2,400,000 | |||||
| Pacific Palisades | $4,225,000 | $3,987,000 | $3,018,000 | |||||
| Hancock Park-Wilshire | $1,790,000 | $1,945,000 | $1,363,112 | |||||
| Beverly Center-Miracle Mile | $1,900,000 | $2,210,000 | $2,100,000 | |||||
| Hollywood | $1,550,000 | $1,497,500 | $1,380,000 | |||||
| Silver Lake – Echo Park | $1,230,000 | $1,425,000 | $900,000 | |||||
| Los Feliz | $1,836,500 | $1,797,000 | $2,700,000 | |||||
| Culver City | $1,402,187 | $1,316,500 | $1,400,000 | |||||
| Westchester | $1,275,500 | $1,298,750 | $1,435,000 | |||||
| Hollywood Hills East | $1,561,500 | $1,543,000 | $1,305,000 | |||||
| Playa Del Rey | $1,745,000 | $1,774,081 | $1,705,000 | |||||
| Malibu Beach | $11,000,000 | $4,300,000 | $5,100,000 | |||||
| Malibu | $2,785,000 | $3,180,000 | $3,325,000 | |||||
| Playa Vista | $2,060,250 | $1,967,500 | $1,865,000 | |||||
| Downtown L.A. | $586,500 | $482,500 | $340,000 | |||||
| Glassell Park | $1,107,500 | $744,250 | $795,500 | |||||
| Mt Washington | $884,500 | $982,500 | $1,302,500 | |||||
| Condos Median Sales Price | ||||||
| Area | Mar 2018 | Mar 2019 | Feb 2019 | |||
| Beverly Hills | $1,235,000 | $1,820,000 | $825,000 | |||
| Sunset Strip – Hollywood | $780,000 | $590,000 | $687,500 | |||
| Westwood – Century City | $956,136 | $1,065000 | $886,500 | |||
| Brentwood | $823,500 | $1,015,100 | $665,000 | |||
| West L.A. | $901,000 | $828,500 | $787,000 | |||
| Beverlywood Vicinity | $819,500 | $898,750 | $740,000 | |||
| West Hollywood Vicinity | $781,000 | $942,000 | $896,825 | |||
| Marina Del Rey | $985,000 | $905,000 | $925,000 | |||
| Palms – Mar Vista | $665,000 | $705,000 | $685,000 | |||
| Santa Monica | $1,140,000 | $1,205,000 | $1,084,500 | |||
| Pacific Palisades | $1,490,000 | $930,000 | $1,369,000 | |||
| Hancock Park-Wilshire | $655,000 | $600,000 | $780,000 | |||
| Beverly Center-Miracle Mile | $1,050,000 | $775,000 | $870,000 | |||
| Hollywood | $686,500 | $709,000 | $727,500 | |||
| Silver Lake – Echo Park | $660,000 | $475,000 | $639,838 | |||
| Los Feliz | $620,500 | $845,000 | $664,000 | |||
| Culver City | $616,750 | $599,000 | $580,000 | |||
| Westchester | $402,500 | $537,000 | $490,000 | |||
| Hollywood Hills East | $715,000 | $735,000 | 0 | |||
| Playa Del Rey | $757,500 | $4721,000 | $475,000 | |||
| Malibu Beach | $1,275,000 | 0 | $1,575,000 | |||
| Malibu | $1,200,000 | $767,000 | $1,211,500 | |||
| Playa Vista | $1,o94,000 | $1,074,000 | $475,000 | |||
| Downtown L.A. | $618,000 | $610,000 | $1,079,000 | |||
Data provided by MLS deemed accurate but not guaranteed
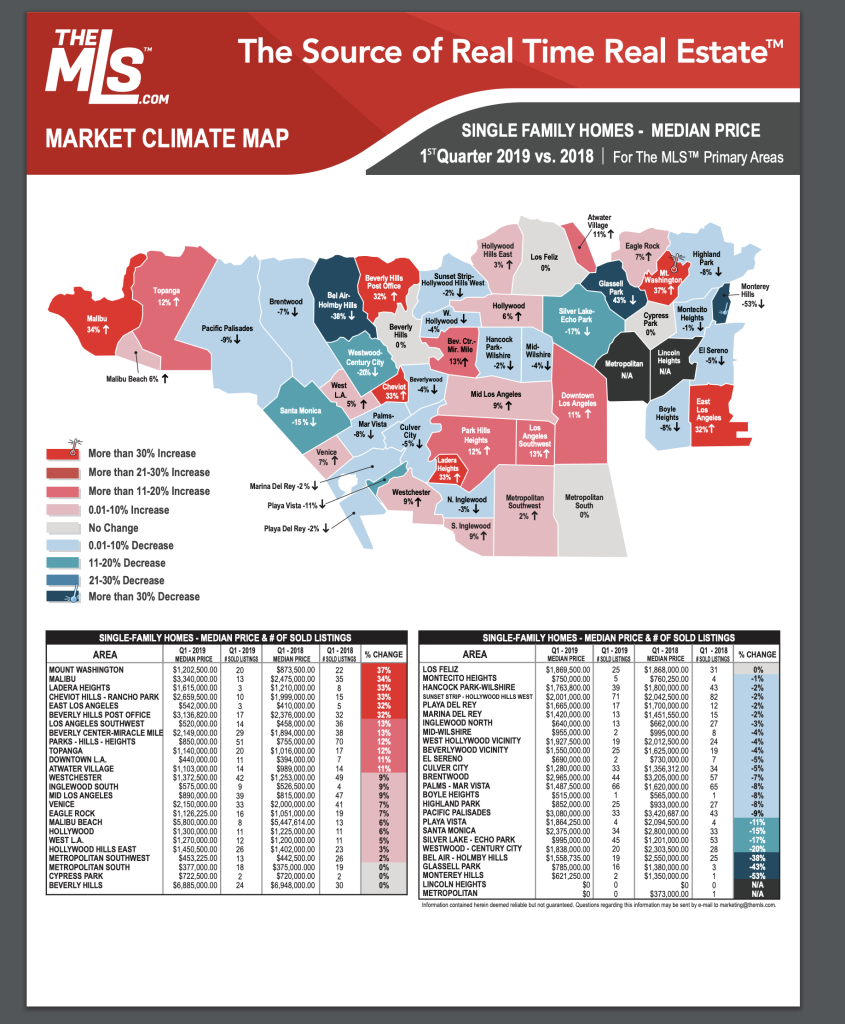
Open the single family home market climate map above to see the changes for the First Quarter 2019 compared with 2018.
| Need Help? Have questions? Fill out the CONTACT FORM or call Jane at 310-351-9208 |